Income and expenditure surveys often tend to bring to fore certain stark trends and statistics. And invariably doubts are raised over the reliability of such data. It should be admitted that there is no fool proof method by which one can establish the reliability of all the survey results. There are, however, certain procedures by which it is possible to make assessment of the degree of confidence that can be placed on the findings of the survey. The most widely used and fruitful procedure is to compare the survey estimates with the estimates generated by other reliable sources despite the difficulty to obtain estimates which are comparable from the point of view of concepts, coverage of population and period to which data refer. However, such comparison provides some basis for judging the degree of reliability and hence an attempt is made to compare the survey results with the available external data.
Demographic characteristics: Information relating to key demographic characteristics of the Indian households is available from various rounds of National Sample Surveys and Census 2011, with which the present survey (ICE 360° Survey, 2021) results can be compared. According to the ICE 360° Survey, there are 307.6 million households in the country, of which 36.3 per cent (111.8 million) live in urban areas and the rest (195.8 million) in rural areas (Table 5). Estimate of average household size from ICE 360° Survey, 2021 (4.60 members) appears consistent with the estimates obtained from NSS 68th round, 2011-12 (4.40 members) and Census 2011 (4.90 members).
Table 5: Estimates of households, population, and household size

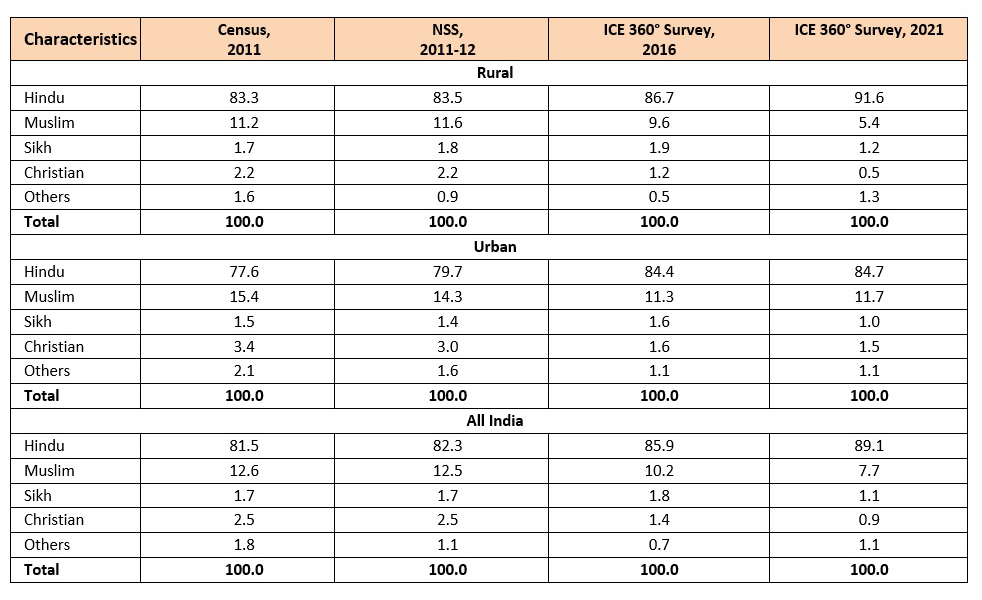
All the three data sources are also comparable on some other parameters, such as the distribution of households by religious groups. It is to be noted that the share of households across different religious groups in rural India as observed in ICE 360° Survey, 2021 appears to be very similar to those obtained from NSS, 2014 (Education Survey) and Census, 2011 estimates. However, in case of urban India, ICE 360° Survey has covered a slightly higher share of Hindus relative to other religions (Table 6).
Table 6: Distribution of households (%) by religion
Sources of Household Income: In case of urban India, while NSSO 68th round reported a considerably higher share of salaried (41.5 per cent) as compared to labourers including other sources (24 per cent), ICE 360° Survey (2021) observed 37 per cent of shares of salaried households and significantly higher share of labourers including other sources, 45 per cent, as the principal sources of income. Share of urban households who are self-employed in non-agriculture activities are not very different across these two sources, although NSS reported a slightly higher share in 2011-12. In rural India, ICE 360° Survey has captured relatively lower shares of self-employed households as compared to NSS (Figures 2 & 3). However, share of casual labour households covered is similar in both the surveys.
Figure 2: Distribution of URBAN households by source of income
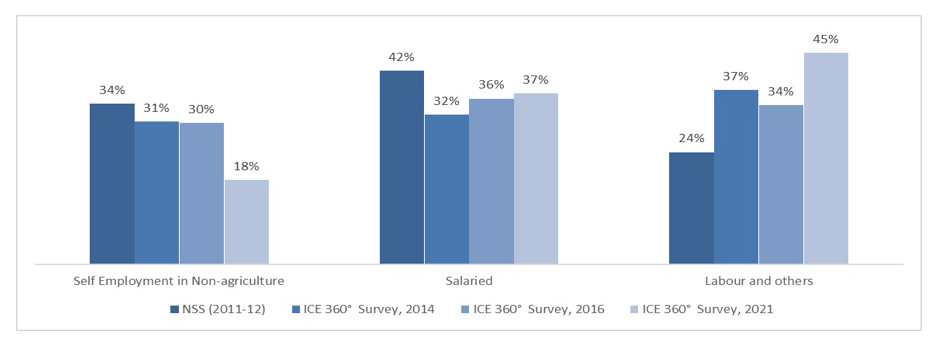
Figure 3: Distribution of RURAL households (%) by source of income

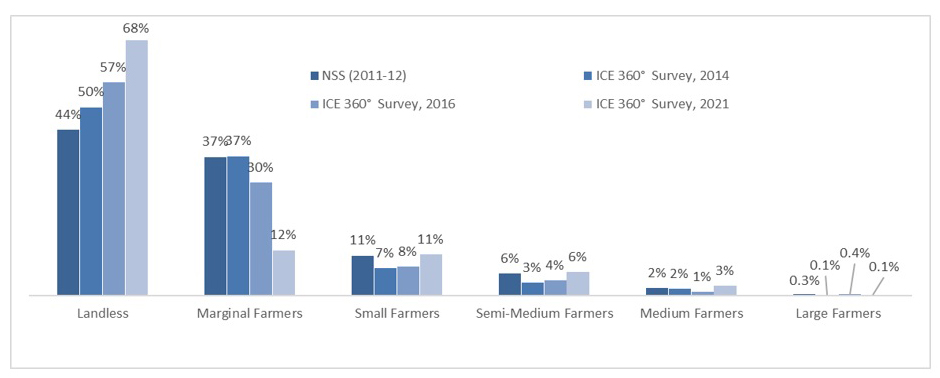
The size of cultivable land owned by a household is an important indicator of the economic status of the household which is certainly more relevant in the context of rural areas as compared to urban. As per ICE 360° Survey 2021, while nearly 68 per cent of rural households in India do not possess any cultivable land, another 12 per cent are marginal farmers (0-1 hectare of land). Since share of landless households have increased over the years, we can see the proportional adjustment in distribution of households across the other land categories between 2011-12 and 2020-21 (Figure 4).
Figure 4: Distribution of RURAL households by cultivable land category
month period, April 2020- March 2021. An estimate of surplus income (as an indicator of savings) is arrived at by subtracting the total household routine expenditure from the total household income. Through this method, this survey found estimates of savings as a proportion of disposable income to be 20.6 per cent.
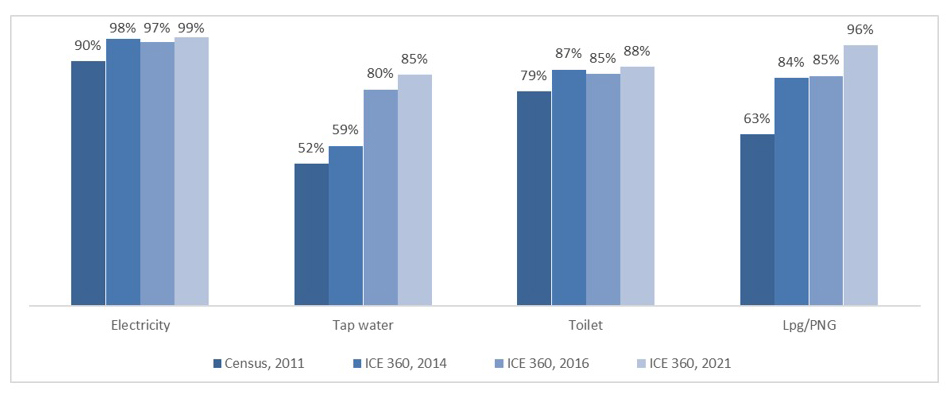
Ownership of Basic Amenities: At all India level, the proportion of households owning different types of basic amenities such as electricity, tap water, toilet and LPG/PNG has improved significantly between 2011 and 2021. In almost all the categories the ownership increased in the range of 20 to 30 percentage points at all India level. Among these four amenities, improvement in ownership between 2011 and 2021 has been relatively lower in case of access of tap water and toilet. Again, improvement in ownership of these amenities is higher in rural India as compared to urban, except for tap water where progress in almost similar in rural and urban areas (Figures 5 to 7).
Figure 5: Access of basic amenities – All India (% of households access)

Figure 6: Access of basic amenities – Rural (% of households access)

Figure 7: Access of basic amenities – Urban (% of households access)
Estimates of Income, Expenditure and Saving: An average household in India had an annual income of 471,185 in 2020-21, and an expenditure of 374,003, leaving it with a surplus of 97,183 to save and invest. Urban income levels are around 610,690 per annum versus 391,538 per annum for rural. Since expenses in urban areas are substantially higher ( 466,309 per annum in urban areas versus 321,302 per annum in rural ones), the differences in the surplus income (of urban and rural areas) that can be saved or invested is not all that huge. As a result, the average urban household saves nearly 2 times that of a rural household ( 144,381 per annum in urban areas versus 70,236 for rural areas).
Extent of income captured by ICE 360° survey: A common problem faced by such surveys is the under-statement of economic data (income, expenditure, and savings) by the respondents. Based on the adopted concept of income in ICE 360 surveys (which includes wages, salaries, bonus, business, profession, farm income and other forms of labour income, pensions, rent, interest, and dividend), the ICE360° survey 2021 estimates of the aggregate income of Indian households are about 60.3 per cent of the total personal disposable income, as provided by the National Accounts Statistics (NAS) for entire country.
These differences in estimates can be attributed to the following factors. One, this survey did not cover some of the smaller states and union territories which account for about 4 per cent of the population. Two, according to the National Statistical Organisation (NSO), the household sector comprises of individuals, non-government non-corporate enterprises of farm business and non-farm business like sole proprietorships and partnerships, and non-profit institutions. This survey, on the other hand, covers only households. Three, certain components of income are not perceived as income by the respondents and hence they get excluded from incomes reported in income surveys. Items like reimbursements for travel, medical and other such expenses are not reported correctly in this survey.
Estimates of Sampling Error: To check the data reliability, a variety of methods are used. The most common amongst them are evaluation of sampling and non-sampling errors. Sampling errors are measurable within the framework of the sample design and are also controllable by varying the size of the sample. For instance, the average per capita income per household is 102,339 and its standard error is 3 per cent (Table 7). The standard error and coefficient of variation of the estimated per capita household income for various income quintiles is consistent and within permissible limits. This generates a fair degree of confidence in the ICE 360° survey estimates.
Table 7: Estimates of standard errors (2020-21)

Another important source of error, which can vitiate the estimates, is the non-response rate. In the case of this survey, it was around 3 per cent and largely due to unanticipated reasons such as the psychology of the respondent. Non-sampling errors arise mainly from three sources. One, respondents refuse to cooperate and deny information; they supply partial information that may not be usable; or they deliberately provide false information. Two, the interviewers are also prone to have some preconceived notions whereby some biases creep into the schedules. Three, respondents may not remember all the relevant numbers sought by the interviewers. And this tends to considerably increase the margin of error in the data collected. There is no satisfactory procedure for a precise measurement of non-sampling errors. A team of trained interviews (180), supervisors (30) and PRICE professionals (10) from different language groups were engaged for about three months to undertake the task of primary data collection. The field team was thoroughly trained through all the phases of the surveys. Every care was taken to implement maximum possible quality control in recording of the answers of the respondents.