The main objective of this exercise is to undertake a detailed national household survey among the rural and urban households across the country to generate reliable estimates of household well-being (such as income, expenditure, savings and related indicators) for all major states and for major town categories. Household is the target unit of the study, with states and urban/rural categories as sub-populations or target groups, for whom representative estimates will be sought. The geographical coverage of the survey includes the entire country comprising of major states and UTs. The survey methodology and sampling design adopted is kept broadly like the last round, which was drawn after reviewing best international practices and worked very well.
Survey procedures such as approach, concepts and definitions, sample design and sample size, content of the questionnaire and estimation procedure were executed after reviewing best national and international practices to fill the data gap on household income. Broadly same approach and survey methodology have been adopted in all three rounds of ICE 360° surveys with further value addition through introduction of new issues/targets and building competitive advantage such as classifying “Something” known but “puzzling”.
A three-stage stratified random sample design has been adopted for the present survey in which a ready-made frame is used for the first two stages and a sampling frame is developed in the last stage. Districts, villages and households form the first, second and third stages of sampling, respectively for selection of the rural sample while cities/towns, urban blocks and households are the three stages of selection for the urban sample. Sampling for rural as well as urban areas is done independently within each state/UTs. Following the basics of sample survey principle that geographical spread is more important than the sample size, both rural and urban sample is selected from a wide cross-section of the country. The rural sample has been selected from a representative number of districts from across the country, while the urban sample covers a range from big metropolitan cities to small towns with population below 5,000. The sample sizes at first, second and third stages in rural and urban areas are determined based on available resources and the derived level of precision for key estimates from the survey, taking into account the experience in conducting the earlier round of ICE 360° survey.
Sampling Frame: The list of 2011 census districts and villages constitute the sampling frame for rural and list of 2011 census cities/towns for urban. In the absence of the definitive list of households (sampling frame), specially designed listing Performa will be used to list households in the selected villages and urban blocks to collect information on various auxiliary variables. In the case of large villages/urban blocks, a fraction of households will be listed based on sampling fraction.
Selection of Rural Sample: In rural, a sample of 105 districts was allocated to the 23 covered states/UTs. Districts were selected, as the first stage sample units, with probability proportional to size and replacement, where rural population of each district as per Census 2011 was used as size measure. Villages formed the second stage of selection pro¬cedure. A total sample of 722 villages (second-stage sampling units) was allocated to the selected 105 districts, approximately in proportion to rural population of each selected district. The allocated number of sample villages was chosen with equal probability sampling approach.
In each of the selected villages, approximately 100 households were selected following equal probability sampling approach for listing purpose and preliminary survey. Besides others, the listing schedule collected information on household’s particulars such as occupation of chief wage earner (CWE), total household income, expenditure, agricultural land, education, occupation, financial inclusion, and wellbeing. A total of 201,900 households were listed comprising 77,699 households from entire rural India.
A well-being score of each listed households are calculated using information such as household income, expenditure, land possessed, ownership of consumer goods, highest education in the households, etc., collected during the listing process. All the listed households were stratified based on wellbeing score generated for each household separately and major source of household income into 10 strata (Table 2).
Table 2: Stratification of rural households
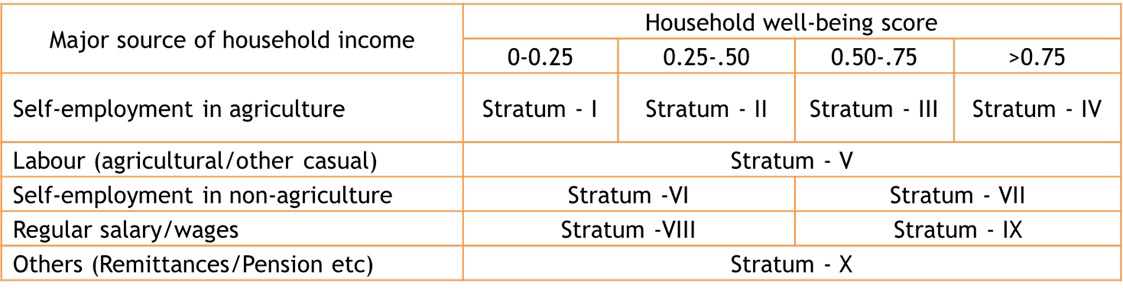
From each of the ten strata, two households were selected by following equal probability sampling approach. In case, any of the strata was found to be missing (no household), then households from previous stratum, where additional households were available, were selected to get 20 sample households in a sample village.
Following the above sampling design in rural areas, in the last round (ICE 360° survey, 2021), the realised sample of 14,704 households out of preliminary listed sample of 77,699 households was spread over 722 villages in 105 districts covering the 23 States/UTs.
Selection of Urban Sample: In the urban, within the 25 covered States/UTs, were again treated as the main strata and a sample of 121 towns (first stage units) were selected covering all sample states. All the cities/towns of having population over a million were selected with a probability one. A progressively increasing sampling fraction with increasing town population class was used for de-termining the number of towns to be selected from remaining towns.
A total sample size of 1,222 urban wards was allocated among the sample towns in proportion to the number of wards in the respective towns, maintaining an equal number of wards allocated to each selected town in a town group.
The allocated number of wards was selected from each sample town, following equal probability sampling approach. Thus, towns and wards formed the first and second-stage sample units in the urban sample design.
Like in the rural sample design, within a selected ward, a sample of about 100-123 households were selected for listing and preliminary survey, following equal probability sampling approach. In the last round (ICE 360° survey, 2021), a total of 124,201 households formed the sampling frame for urban India. A well-being score of each listed households are calculated using information such as household income, expenditure, ownership of consumer goods, highest education in the households, etc. collected during the listing process. All the listed households were stratified based on wellbeing score generated for each household separately and major source of household income into 10 strata (Table 3).
Table 3: Stratification of urban households
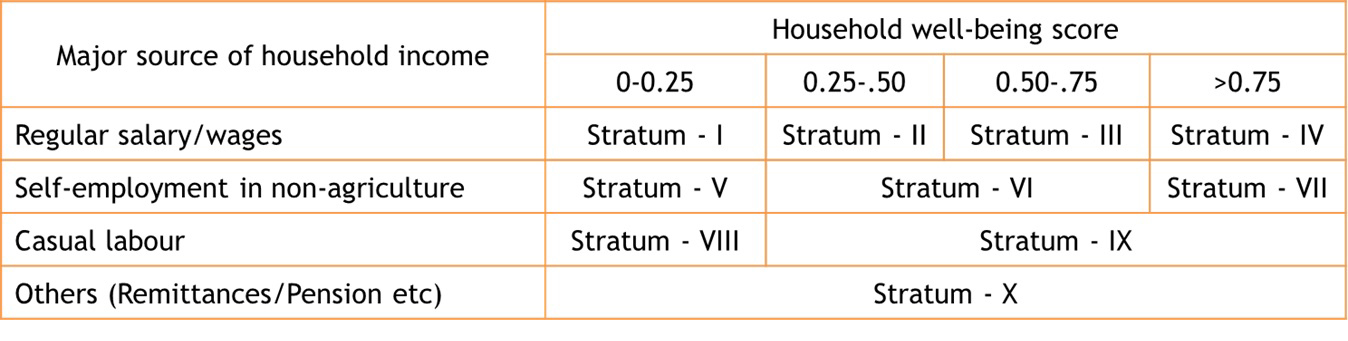
From each of the above strata, 2 households were selected at random with equal probability of selection. If there was no household in any of the strata, the shortfall was compensated from the previous stratum, where additional households were available, to get 20 sample households from each sample urban blocks in urban sector for detailed survey.
Following the above sampling design in urban areas, the realised sample of 25,723 households, out of preliminary listed sample of 124,201 households, was spread over 1,222 urban wards in 121 towns covering the 23 States/UTs.